Building a Logging Pipeline on AWS
Originally published: 2018-08-04
Last updated: 2019-09-25
Effective logging is a challenge. Effective logging with cloud deployments is more of a challenge, because you have to consider these additional factors:
- You may have many machines writing logs.
To inspect those logs you either need to go to the machines themselves, pull the logs to your workstation, or push them to a centralized location. And your system operations group may have very strong feelings about some of these options.
- You may have many machines running the same application.
To track down a problem, you will have to examine multiple logfiles, and be able to identify which machine they came from.
- You may need to correlate log messages from different applications.
This is a particular problem in a micro-service architecture: your web requests may fail due to a remote service, meaning that you have to correlate logs from different machines.
- Machines regularly shut down.
The promise of cloud deployments is that you can scale-up and scale-down in response to actual load. However, scaling down means terminating the instance, and that means losing all files that haven't been retrieved or pushed to a central location.
Fortunately, centralized logging is a solved problem. However, there are many different solutions, usually involving agents that read local logfiles and push them to a central server. And “solved” that doesn't necessarily mean that you'll find an out-of-the-box solution for your deployment:
- Your logfiles may not follow a standard format.
Most solutions use an agent to parse logfiles, and send a parsed representation to the central storage server. If you use a “standard” logfile format, then you can use an out-of-the-box agent configuration and everything Just Works™. But if you've added information to the log (such as leveraging Log4J's mapped diagnostic context), you will have to change the parser, typically via regexes.
- Self-hosted solutions require you to don an Operations hat.
The most common self-hosted solution is the “ELK” stack: Elasticsearch, Logstash, and Kibana. However, to run this you need to provision machines, apply patches, monitor them, solve any problems that arise, and scale as needed. All of which takes away from the time to develop the applications writing those logs.
- Managed solutions can be very expensive.
The alternative to self-hosting is a managed solution, such as Loggly, SumoLogic, or Splunk. These can be a great solution, especially for small deployments: not only do they manage the servers, but they provide value-added services such as analyzing your logs to identify anomalous events automatically. But you pay for that service, especially as your volume increases: I looked at the cost of Loggly before building my own pipeline, and a 150-machine deployment fell into their “call us” pricing plan.
- You may need to retain your log messages.
A search engine is a great tool for examining logs and identifying recent problems, but it's not a good solution for long-term log archiving. While many organizations don't care about logs that are more than a few days or weeks old, others (especially in regulated industries) have to retain them much longer, perhaps forever.
This article presents a “home grown” solution to those problems, using
Amazon Kinesis Streams and Kinesis Firehose as a pipeline to feed AWS Elasticsearch:
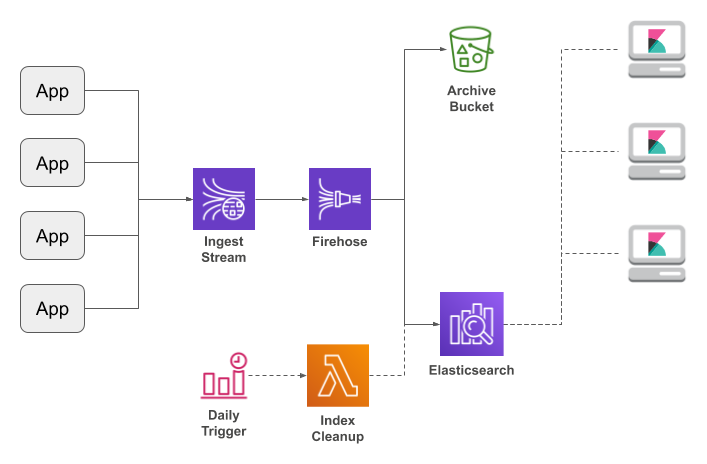
Kibana
I'm going to start at the very end of the pipeline, and work my way backwards from there.
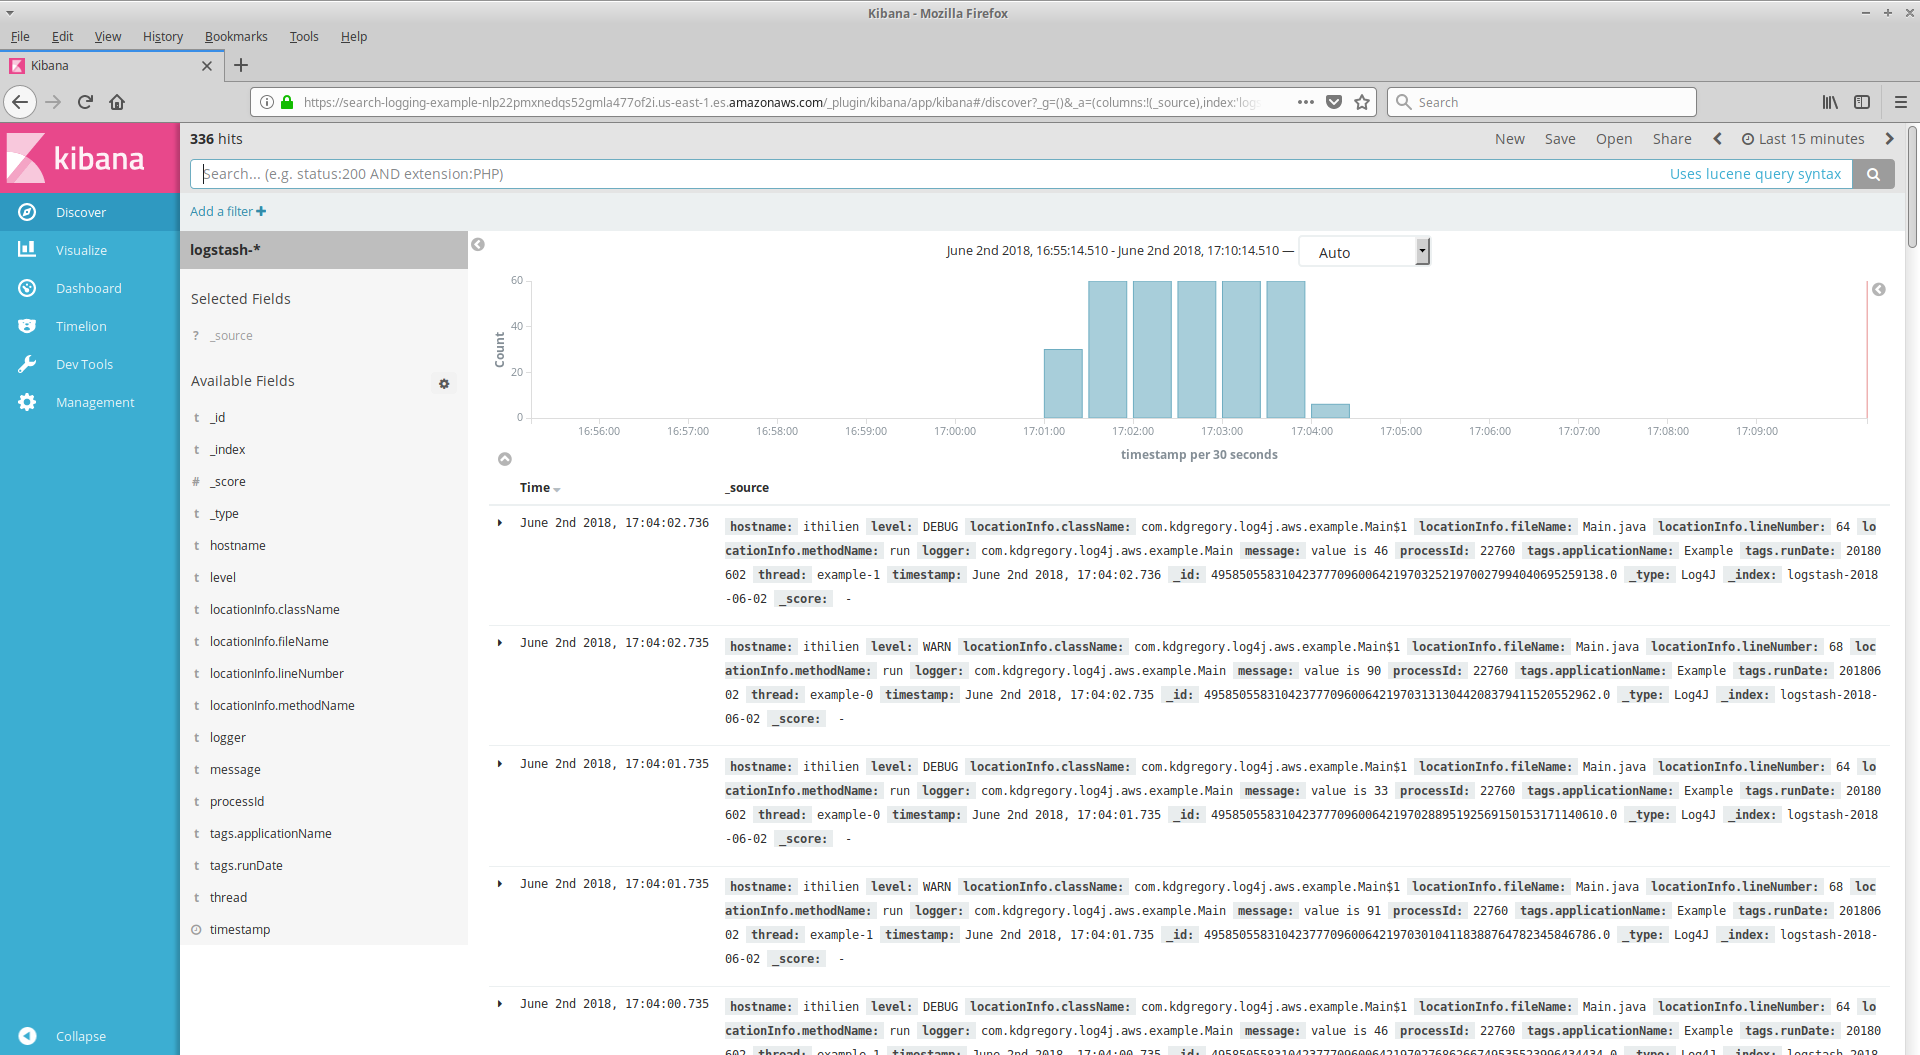
Kibana is an “analytics and visualization platform” for Elasticsearch: it gives you a browser UI that allows you to search and filter logs, without writing explicit Elasticsearch queries. AWS Elasticsearch provides Kibana as a built-in feature, linked from the cluster's “Overview” tab.
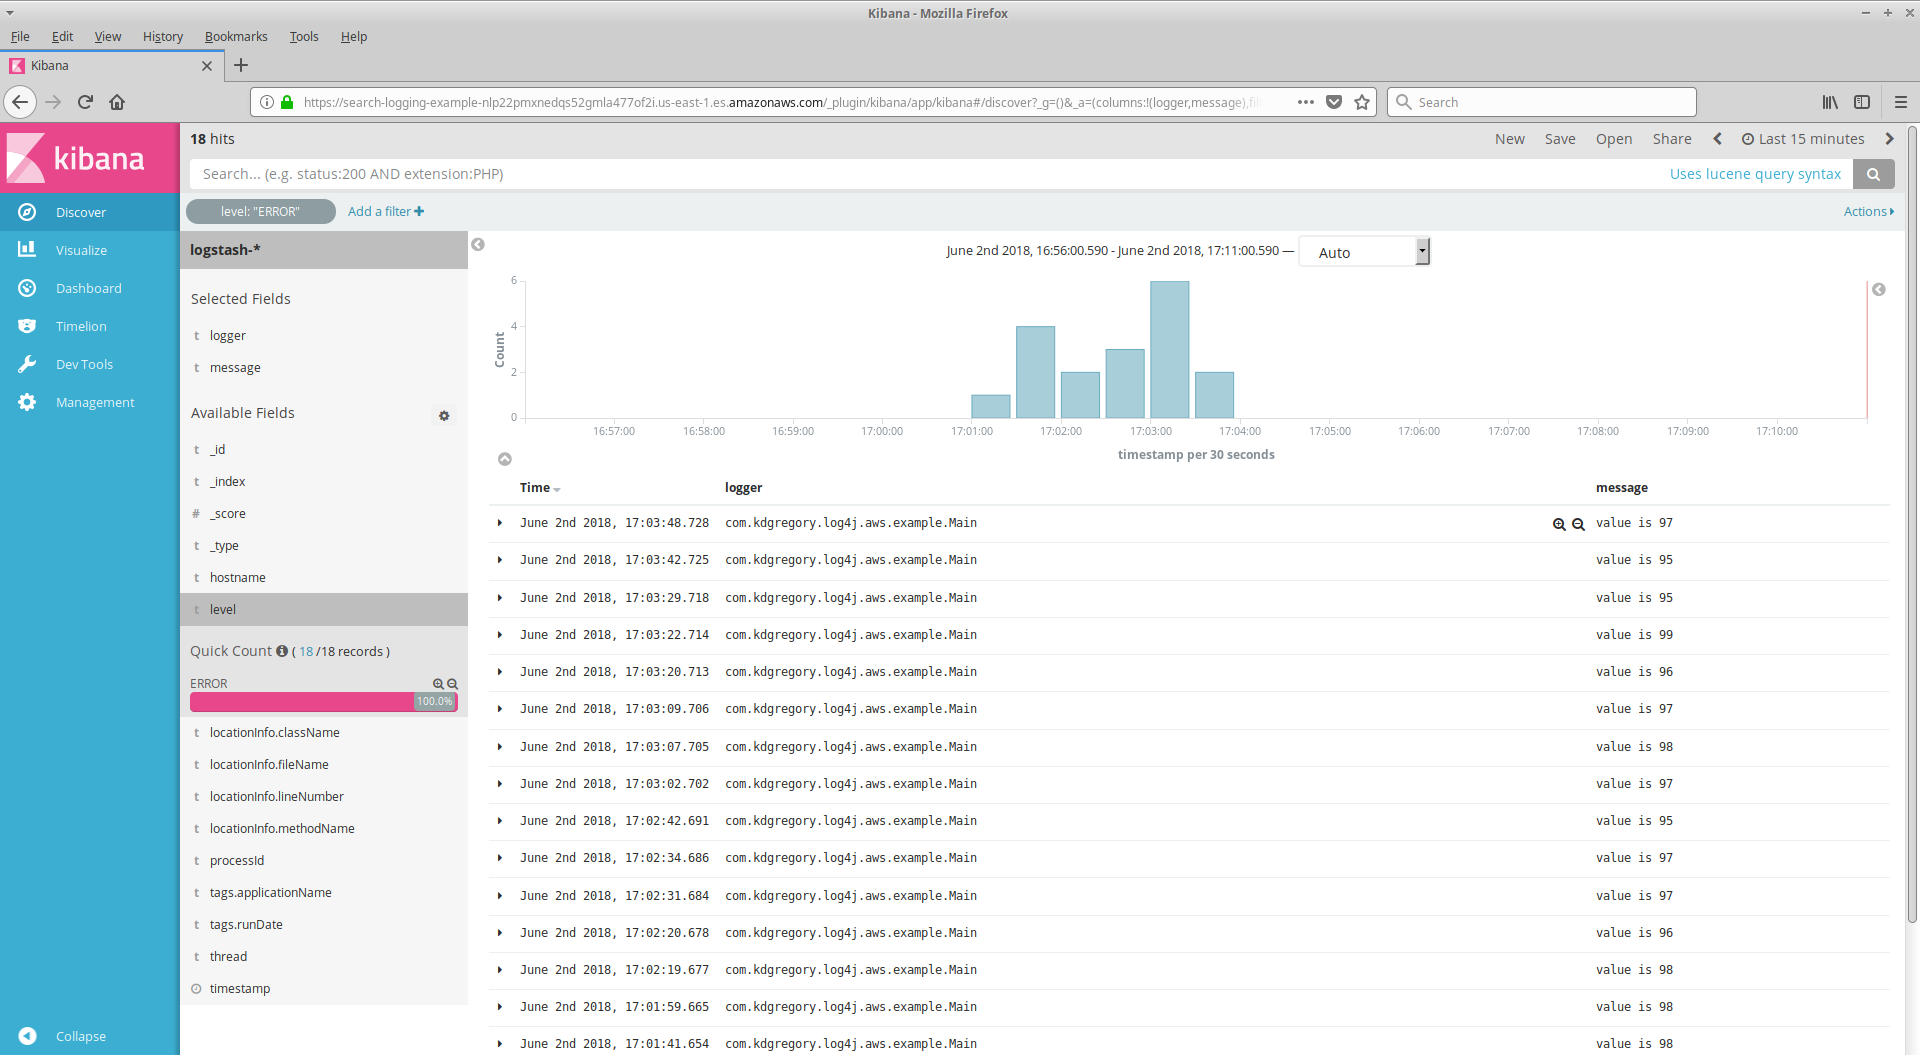
I'm not going to give a complete description of Kibana here; the manual (linked above) does a much better job of that. But to give you a flavor of how it looks and works, here are two screenshots (click to open full-size in a new tab). The one on the left shows the interface immediately after opening the Kibana window: it's a list of the most recent log messages, with all available data. The screenshot on the right shows only error-level messages, and limits the displayed information to timestamp, logger name, and message.
 |
 |
For me, a typical Kibana session is focused on investigating an application error. So I'll start by picking the approximate time range that the error occurred (the default shows messages from the last 15 minutes, which is great for monitoring but not debugging). Then I add a filter for the application, and change the output to show just timestamp, classname, and log message. Lastly, I either add a filter for log level (warn or error), or search for words that I think are likely to indicate the issue. From there, I expand my search query to include nearby messages from the same or related services. Assuming that the logs contain relevant messages, my time from error report to identifying the problem is around 15 minutes.
And one of the nice features of Kibana is that the page URL includes all of the filters that you applied to the search. So if you want another person to see the same thing that you do, simply send them the URL.
AWS Elasticsearch
Elasticsearch is a distributed search engine: it stores indexed data on multiple nodes, allowing parallel searches and redundant storage. Amazon Elasticsearch Service is a managed Elasticsearch cluster: you tell it how many nodes you want and how much disk space you want per node, and it does the rest. Of course, you give up some of the flexibility of a self-managed solution to do this, but for workloads like log management, it's more than sufficient.
OK, configuration does require a bit more thought than “number of nodes and how much disk,” but not much more.
Instance Types and Storage
The size of your cluster will depend on both the amount of log data that it ingests and the type of queries that you'll run against that data. Which means that you won't really know the best configuration until you've been running for a few weeks. Fortunately, you can easily scale your cluster once you have data in it, so you're not locked into the choices you make now.
If you're currently writing logfiles to disk you can estimate your storage requirements by multiplying the size of your daily logfile(s) by the number of days that you want to keep, add 20% for indexing overhead, and then double to account for replication. Then give yourself an additional 25% to handle situations like a rogue application writing a constant stream of error messages.
Or just pick a big number and scale down as needed. In my experience, 3 TB total storage was sufficient for a month of 30GB daily logs, with around 400GB reserved as a buffer. Be aware that your instance type will determine the maximum per-node storage space; see the docs for details.
As long as you have enough disk space, the number of nodes and their instance type largely
depend on your query workload. Amazon
recommends no fewer than three nodes, and starting with a larger instance type than you think you'll
need. In my experience, six m4.large.elasticsearch instances were
sufficient to handle infrequent queries that generally examined a day's worth of logging
with filter expressions on the application name or classname.
Amazon also recommends using three dedicated master nodes for a production cluster. The master nodes are responsible for monitoring the overall health of a cluster, as well as coordinating index storage and replication. If you don't use dedicated master nodes, that functionality will run on the data nodes, where high utilitization may prevent the master node component from functioning correctly. That said, I didn't use dedicated master nodes and never saw an issue.
Lastly, you can enable zone awareness, which replicates data into a different availability zone. Enabling this feature will incur costs for inter-zone network traffic, although those should be small. I think that this option is more relevant for public-facing search clusters than one used for logging, but entire availability zones have gone down in the past; if you need to ensure that your cluster is always available, turn on this option.
Networking and Security
Since October 2017, you have a choice of running your Elasicsearch cluster inside the VPC or on the open Internet. However, as of this writing Kinesis Firehose can't write to an in-VPC cluster, so the choice is easy: ignore Amazon's recommendation and choose “Public Access” when asked for network configuration.
The reason that Amazon recommends running inside a VPC is that an Elasticsearch cluster is managed via HTTP calls — not just for queries, but also for management, including index deletion. So it's imperative to restrict access to your cluster. This starts with an access policy that's attached to the cluster itself. In addition to the cluster's access policy, you can also use IAM policies to grant access to the cluster.
I don't particularly like splitting the responsibilities between a cluster-attached policy and an IAM policy: this makes it more difficult to identify how a user or application received access (and the AWS limit of 10 policies per role also pushes you toward policies that affect multiple resources). Instead, I prefer a cluster policy that grants access to specific “functional” roles, which are then assigned to the applications that perform those functions.
Here is an example cluster policy that does just that, along with granting access to specific IP addresses (we'll use these roles later in this article).
{
  "Version": "2012-10-17",
  "Statement": [
    {
      "Effect": "Allow",
      "Principal": {
        "AWS": "arn:aws:iam::123456789012:role/Elasticsearch_Cleanup_Role"
      },
      "Action": [
        "es:ESHttpDelete",
        "es:ESHttpGet"
      ],
      "Resource": "arn:aws:es:us-east-1:123456789012:domain/example/*"
    },
    {
      "Effect": "Allow",
      "Principal": {
        "AWS": "*"
      },
      "Action": [
        "es:ESHttpGet",
        "es:ESHttpHead",
        "es:ESHttpPost"
      ],
      "Resource": "arn:aws:es:us-east-1:123456789012:domain/example/*",
      "Condition": {
        "IpAddress": {
          "aws:SourceIp": [
            "123.45.67.123",
            "123.45.67.456"
          ]
        }
      }
    }
  ]
}
The Pipeline: Kinesis Streams and Kinesis Firehose
Logstash — the “L” in the ELK stack — is the traditional way to feed an Elasticsearch cluster. It is an agent that parses log messages, formats them as JSON, and then writes the JSON to the Elasticsearch cluster. It can be installed on every instance or as a centralized logging daemon accepting TCP connections from the instances. And it's the part of the ELK stack that I like the least. Instead, I use Amazon's Kinesis services to accept messages directly from the application and upload them to Elasticsearch.
Kinesis Streams
A Kinesis Stream is a durable log of messages: multiple producers can add messages to the log, those messages remain in the log for a specific time duration (by default, one day), and during that time multiple consumers can read from the log. It occupies a space between a traditional message queue, where each message is consumed by a single consumer, and pub-sub, where consumers must be active at the time of publication in order to receive a message. In my pipeline there is only one consumer, the Firehose, but you could add additional consumers such as a Kinesis Analytics application to produce a real-time error dashboard.
One of the key features of a Kinesis stream is that it's scalable: you can use a small stream when you have only a few applications, then increase capacity as your number of applications increases. The unit of scaling is the shard: each shard can accept a total of 1,000 messages per second from any number of producers. That may seem like a large number, but a single production app-server instance could easily produce hundreds of log entries per second.
If you don't know your message volume start with four shards, monitor, and resize as needed. You can monitor a stream from the AWS Console, and the metric that you should watch is “Write Throughput Exceeded”: while it's OK if you occasionally exceed the stream's throughput, you must give it a chance to catch up.
The other part of stream configuration is an IAM policy that allows applications to write to the stream. My preference is to include these permissions in a general logging policy, which also includes the permissions to write messages to CloudWatch Logs and CloudWatch Metrics. Note that my example policy differs in its resource specifications for the different services: the CloudWatch permissions grant access to any resource, while the Kinesis permissions are limited to only few operations and a single stream. This is because Kinesis streams may be used for multiple purposes in your organization, and you don't want a misconfigured client to write to the wrong stream.
{
    "Version": "2012-10-17",
    "Statement": [
        {
            "Effect": "Allow",
            "Action": [
                "cloudwatch:PutMetricData"
            ],
            "Resource": "*"
        },
        {
            "Effect": "Allow",
            "Action": [
                "logs:CreateLogStream",
                "logs:DescribeLogGroups",
                "logs:DescribeLogStreams",
                "logs:CreateLogGroup",
                "logs:PutLogEvents"
            ],
            "Resource": "*"
        },
        {
            "Effect": "Allow",
            "Action": [
                "kinesis:PutRecords",
                "kinesis:DescribeStream"
            ],
            "Resource": "arn:aws:kinesis:us-east-1:123456789012:stream/example"
        }
    ]
}
Kinesis Firehose
Kinesis Firehose is a managed service that aggregates streaming data into batches and uploads those batches to other services (as of this writing, Elasticsearch, S3, and Amazon Redshift). You control the size of these batches by configuring Firehose with duration and size: it will accumulate messages for the specified amount of time, unless it hits the size limit first.
For this pipeline, the source of the Firehose will be a Kinesis stream, and the destination will be both the Elasticsearch cluster and an S3 bucket (to provide a permanent archive). While Firehose lets you invoke Lambda functions to transform the data during processing, there's no need to do that, at least for your initial pipeline (you may find it useful, later, to extract information from inside log messages, but that's out of the scope of this article).
You can only pick one destination for the stream (with the caveat that S3 may be a backup for another destination). When you choose Elasticsearch, you'll need to give the Firehose information about your cluster:
- Domain
This is the name of your Elasticsearch cluster. You must create the cluster before creating the firehose, and if you're creating the firehose from the AWS Console you'll be able to pick the cluster name from a drop-down.
- Index Name and Rotation
Elasticsearch stores data in Lucene indexes, sharded to different physical machines in the cluster. Index sizing is somewhat of a black art (see links at end for more information): you want indexes that are large enough to be stored and search efficiently, but not so large that you're examining unnecessary data for every query.
Without going to a lot of effort, however, your ability to control index size is limited to how frequently you create new indexes. Firehose lets you control this with the “Index rotation” parameter: you can pick hourly, daily, weekly, monthly, or not rotate at all. For most people, daily rotation is reasonable. If you have particularly high volume, hourly may be better. Do not pick “no rotation” or you'll never be able to clean up old data.
The index name parameter (just called “Index” in the console) is actually the base name for an index; Firehose will append a datestamp based on the rotation interval. For example, if you pick “
foo” along with daily rotation then the actual names will look like “foo-2018-07-01”; with hourly rotation you'll get “foo-2018-07-01T12”.It doesn't matter what name you pick, so pick something that you like. I use “
logstash” even though that tool isn't part of the pipeline. - Type
Elasticsearch defines types to describe how a record should be interpreted (and, I believe, as a way to separate different types of data in the same index). The name you pick doesn't matter; I use “
Log4J”. - Retry duration
Elasticsearch may not be able to accept a batch of records, or Kinesis may not be able to provide them (although that's not likely). Firehose will then retry the operation several times, with a configurable delay. I see no reason to change the default of 300 seconds.
- S3 backup
You can either archive all records to S3, or only those records that could not be written to Elasticsearch (but you need to archive something). You need to provide a bucket name, and an optional path within this bucket. I think you'll probably want to dedicate a bucket to logging, although you might want to share that bucket with ELB logs (described later).
The most important piece of configuration is the buffer size and interval. For Elasticsearch, the overriding concern is latency: you want to see log messages shortly after they're emitted. For S3, however, you generally want to create larger files, so that long-term storage can use the lower-priced “Infrequent Access” storage type.
Unfortunately, the AWS Console only allows you to pick one set of values, which are applied to both destinations. If you create your firehose via CloudFormation, you can specify independent values. I recommend optimizing for Elasticsearch, choosing the minimum allowed interval of 60 seconds.
The last configuration item is an IAM role. Firehose needs permission to do its work, which includes:
- Describing the Kinesis stream and retrieving records from it.
- Describing the Elasticsearch domain and writing records to it.
- Uploading records to S3.
- Invoking a transformation Lambda, if one exists (in our case, it doesn't).
- Writing error messages to CloudWatch Logs.
When creating the Firehose via the console, you're given the option of creating this role at the same time; for your first pipeline I recommend doing just that. Note that this auto-created role includes permissions to update the Elasticsearch cluster, which goes against my preference for the cluster to grant its own permissions.
Feeding the Pipeline
At this point you have a pipeline, but no log data to put into it. Before talking about ways to get data into the pipeline, I want to share the most important thing I know about application logging:
Write your log messages as JSON
There are two reasons. First, JSON is the input format that Elasticsearch wants; if you use some other format then you'll need to parse it into JSON (which, as I've said, is why Logstash exists, and which can be a painful mess of regexes). The second, and in my opinion bigger, reason is that JSON is extensible: you can add fields as needed, and one message may differ from another (which isn't easy to parse with regexes).
This extensibility is particuarly important in a distributed environment, because it lets you add information. Here I've added the source hostname and deployment tags; Elasticsearch can search or filter by any of these values, which can let you answer questions such as “does this error happen only in production?”
{
	"hostname": "ithilien",
	"level": "DEBUG",
	"logger": "org.springframework.samples.petclinic.service.ClinicServiceImpl",
	"message": "findOwnerByLastName(franklin)",
	"processId": "5971",
	"tags": {
		"applicationName": "Example",
		"deployedTo": "prod"
	},
	"thread": "http-bio-9966-exec-4",
	"timestamp": "2018-03-12T15:41:31.564Z"
}
Another big benefit of JSON is that all mainstream development languages have some way to convert their internal structures into it (albeit sometimes via a third-party library). This means that you can take a polyglot approach to development yet still have a holistic view of your logging output.
Given this flexibility, I can't cover all of the ways to get your log messages into Kinesis. So I'll focus on two: one for the JVM (which is my primary platform), and one for “everything else.”
Log4J/Logback Appender
Since this is my article, I'm going to make a shameless plug for the appender library that I wrote. If you're using Log4J 1.x or Logback, I think that it's by far the best solution, and will write output to CloudWatch Logs and SNS as well as Kinesis. But Google will show you a lot of alternatives.
To use my appenders, you must first include them as a dependency of your project. Assuming
that you're using Log4J 1.x, and Maven, you would add this dependency to your POM (see the project README for information about Logback, as well as links to find the latest versions on Maven Central).
<dependency>
    <groupId>com.kdgregory.logging</groupId>
    <artifactId>log4j1-aws-appenders</artifactId>
    <version>2.2.1</version>
</dependency>
You'll also need to add a dependency for the
Kinesis SDK.
My appenders library is designed to work with any 1.11.x SDK version, and marks
the dependency as “provided”: there are a lot of 1.11.x
releases, some of them are not backwards compatible, and I didn't want to put
anyone in dependency hell. If you're already using AWS then you probably have a
preferred version; if not, here's a recent version as-of this writing:
<dependency>
    <groupId>com.amazonaws</groupId>
    <artifactId>aws-java-sdk-kinesis</artifactId>
    <version>1.11.500</version>
</dependency>
Next, you'll need to update your log4j.properties file to configure
the appender. I'll assume that you're starting with a file like this, which writes all log
messages to the console:
log4j.rootLogger=INFO, console

log4j.appender.console=org.apache.log4j.ConsoleAppender
log4j.appender.console.layout=org.apache.log4j.PatternLayout
log4j.appender.console.layout.ConversionPattern=%d [%t] %-5p %c - %m%n
To log to Kinesis you need to add an appender definition, and reference that definition in
the rootLogger configuration:
log4j.rootLogger=INFO, console, kinesis

log4j.appender.console=org.apache.log4j.ConsoleAppender
log4j.appender.console.layout=org.apache.log4j.PatternLayout
log4j.appender.console.layout.ConversionPattern=%d [%t] %-5p %c - %m%n

log4j.appender.kinesis=com.kdgregory.log4j.aws.KinesisAppender
log4j.appender.kinesis.streamName=Example
log4j.appender.kinesis.layout=com.kdgregory.log4j.aws.JsonLayout
log4j.appender.kinesis.layout.tags=applicationName=Example,deployedTo={env:ENV},runDate={date}
log4j.appender.kinesis.layout.enableHostname=true
There are actually two parts to the Kinesis configuration: the first is the appender, and
the second is the layout. Here I'm configuring the appender to write to the Kinesis stream
named “Example” and using default values for the rest of its
configuration (you'll find the appender configuration documented
here).
For layout, JsonLayout is responsible for converting the Log4J
logging event into a JSON representation, potentially adding metadata such as the
application name and deployment destination (you'll find complete documented
here).
The AWS Kinesis Agent
My appenders library is great if you're using a JVM language (and one of the supported logging frameworks), but what if you have components written in Python, JavaScript, or any other common language? It's possible that you'll find a logging library that will let you write JSON directly to Kinesis, but if not you can write JSON messages to a file and use the AWS Kinesis Agent to write them to the Kinesis stream.
Installing the agent is not difficult, but will probably require that you download the code from GitHub. While the documentation says that you can just install a package on the AWS Linux AMI, that means the original AMI; the “Amazon Linux 2 AMI” doesn't have the package available. In my opinion this is yet another reason to use pre-built AMIs for your deployments.
I won't go into the configuration process/options in detail; that's covered quite well in the docs. However, here are some points that might not be obvious:
- Write each JSON record as a single line
The agent supports multi-line records, using a regex to identify the breaks between records. Which means you could emit pretty-printed JSON, and use “
^{$” to identify each record, but this is needless complexity and will also mean a lot of needless whitespace in the records (and remember, you're limited to 1MB/shard/second). - All applications should use the same field names in their logs
This is best explained by example: in a micro-services environment, it's extremely useful to have a “request token” that's generated when the user makes a request, and is logged by each of the components that process that request. However, if one service logs it as “
requestId” and another logs it as “token”, you won't be able to easily link those messages to get a holistic view of the request. Save yourself some trouble: come up with a standard log message that every service will generate, and let them add whatever service-specific fields are needed (JSON is extensible!). - Write to a Kinesis Stream, not directly to Kinesis Firehose
The Kinesis Agent allows you to send records to a Stream or a Firehose. My pipeline architecture uses streams to allow scaling ingest: you can easily adjust the number of shards to match your load. Firehose has a fixed limit on ingest rate, of 1,000 or 5,000 records per second depending on region. And while you can submit an AWS Support ticket to change those limits, there's a note in the API docs that a too-large limit will lead to smaller output batches.
- You need to install Java
This is, surprisingly, not one of the prerequisites listed in the Kinesis docs, but it is noted in the GitHub README. Beware that, as of this writing, only Java versions 7 and 8 are supported (there's an issue that describes the problem with later versions and provides a work-around).
Troubleshooting
If you've been following along, setting up the components, you should now see your log messages in Elasticsearch. If not, here are some steps to take to figure out why not.
- Verify that your logging framework is using the appender
Log4J provides a debugging property,
log4j.configDebugthat will write internal logging messages to the console; Logback will let you turn on debugging in the config file. Your first step should be to write a small program that sends log messages, and run it with this property enabled (there's just such a program in the “examples” directory of my appenders project).java -Dlog4j.configDebug=true -jar target/aws-appenders-example-2.2.1.jar
When you run this, you should see messages like the following. If you made any mistakes in the configuration (such as setting the property
sreamNamerather thanstreamName), there will be a warning message here.log4j: Parsing appender named "kinesis". log4j: Parsing layout options for "kinesis". log4j: Setting property [enableHostname] to [true]. log4j: Setting property [enableLocation] to [true]. log4j: Setting property [tags] to [applicationName=Example,runDate={date}]. log4j: End of parsing for "kinesis". log4j: Setting property [streamName] to [AppenderExample]. log4j: Parsed "kinesis" options.Assuming that
log4j.propertieshas a valid configuration, you should see the following message, which indicates that the appender is running. This message does not, however, indicate that the appender is able to write to the stream, since the actual writing takes place on a background thread.log4j: KinesisLogWriter: created client from factory: com.amazonaws.services.kinesis.AmazonKinesisClientBuilder.defaultClient
- Verify that your application has permissions to write to the stream
If the appender isn't able to write to the stream — and this will almost always be due to an incorrectly-named stream or invalid credentials — you'll see a message like the following further down in the console output:
log4j:ERROR initialization failed: unable to configure stream: AppenderExample
com.amazonaws.SdkClientException: Unable to load AWS credentials from any provider in the chain
Once you know that the sample application works, make sure that your application uses the same debugging configuration and use the Log4J debug property to verify its operation.
- Verify that Firehose can read from Kinesis and write to the Elasticsearch cluster
If you let the console create
firehose_delivery_rolethen you should have all of the permissions that you need (unless, of course, you configured the Elasticsearch cluster to deny all access). If you manually create the service role, or change the permissions it grants, then the Firehose may not be able to process data.You can identify both of these problems from the “Amazon Elasticsearch Service Logs” tab when looking at the Firehose in the AWS console. If unable to read from Kinesis you'll see a message with the error code
Kinesis.AccessDenied; if unable to write to Elasticsearch, the error code will beES.AccessDenied.
Cleaning Up Old Indexes
One of the problems with this pipeline (or any Elasticsearch-based solution) is that
Elasticsearch does not automatically clean up old indexes. You can clean up manually
— it's a simple HTTP DELETE, after all — but it's
more in keeping with the idea of managed services if it happens automatically. My
solution is an AWS Lambda function, invoked daily, which retrieves a list of the
cluster's indexes and deletes all but a specified number of them.
I originally wrote this section as a blog post. That post tried to cover all possible configurations of Elasticsearch, running the Lambda both inside and outside of a VPC. This version focuses on the Elasticsearch cluster described above, with an outside-the-VPC Lambda.
The Lambda function
Diving right in, here's the Lambda function. It's Python 3, which I find to be the easiest language for Lambda functions.
# Copyright 2018 Keith D Gregory
#
# Licensed under the Apache License, Version 2.0 (the "License");
# you may not use this file except in compliance with the License.
# You may obtain a copy of the License at
#
#    http://www.apache.org/licenses/LICENSE-2.0
#
# Unless required by applicable law or agreed to in writing, software
# distributed under the License is distributed on an "AS IS" BASIS,
# WITHOUT WARRANTIES OR CONDITIONS OF ANY KIND, either express or implied.
# See the License for the specific language governing permissions and
# limitations under the License.
#
# Contains example code from https://github.com/DavidMuller/aws-requests-auth

import json
import os
import requests

from aws_requests_auth.aws_auth import AWSRequestsAuth

def lambda_handler(event, context):
    es_host = os.environ['ELASTIC_SEARCH_HOSTNAME']
    num_indexes_to_keep = int(os.environ['NUM_INDEXES_TO_KEEP'])
    index_prefix = os.environ['INDEX_PREFIX']

    auth = AWSRequestsAuth(aws_access_key=os.environ['AWS_ACCESS_KEY_ID'],
                           aws_secret_access_key=os.environ['AWS_SECRET_ACCESS_KEY'],
                           aws_token=os.environ['AWS_SESSION_TOKEN'],
                           aws_region=os.environ['AWS_REGION'],
                           aws_service='es',
                           aws_host=es_host)

    indexResponse = requests.get('https://' + es_host + '/*', auth=auth)
    if (indexResponse.status_code != 200):
        raise Exception('failed to retrieve indexes: ' + indexResponse.text)

    indexData = indexResponse.json()
    indexNames = sorted([x for x in indexData.keys() if x.startswith(index_prefix)])
    indexesToDelete = indexNames[0 : max(0, len(indexNames) - num_indexes_to_keep)]

    for idx in indexesToDelete:
        deleteResponse = requests.delete('https://' + es_host + '/' + idx, auth=auth)
        if deleteResponse.status_code == 200:
            print("deleted " + idx)
        else:
            raise Exception("failed to delete " + idx + ": " + deleteResponse.text)
It's fairly simple: the first get() finds all of the indexes in the
cluster. These are then filtered based on the configured prefix, which is the index name
that you specified when configuring the firehose. The filtered list is then sorted, relying
on the firehose-appended timestamp to provide order. Next is to identify the indexes to be
discarded, and lastly to iterate through them calling delete().
The tricky part is that it can't use Python's built-in http module,
because the cluster requires requests to be signed. So instead I use the
requests and
aws-requests-auth modules.
Which in turn means that you can't simply paste the code into the AWS Console, you must
must create an upload package that includes the necessary libraries. The following
instructions are written for AWS Linux (and won't work on Ubuntu due to
this bug);
I recommend spinning up a new t2.micro instance to run them.
First, make sure that you have the development tools installed:
sudo yum install python3 python3-pip wget zip
Next, create a directory for the package, and save the Lambda function in it with the
name lambda_function.py. Or, pull it from my Github account, as
shown here.
mkdir es-cleanup
chdir es-cleanup
wget https://raw.githubusercontent.com/kdgregory/aws-misc/master/lambda/es-cleanup-signed/lambda_function.py
Then use pip to install the dependencies into that directory.
pip3 install -t `pwd` requests aws-requests-auth
Lastly, zip up the contents of the directory (from within the directory) so that you can upload it to Lambda.
zip -r /tmp/escleanup.zip .
If you've never worked with Lambda before, I recommend stopping here and working through the AWS tutorial to understand the various pages of the Lambda creation wizard. If you have created Lambda functions before, here are the highlights for this one:
- Name your function whatever you like; I named it “
ElasticsearchCleanup”. - Pick the Python 3.6 runtime (or whichever Python 3 runtime is current when you're reading this).
- If you haven't already created the “
ElasticsearchCleanup” role, you can tell the wizard to create a custom role. The role that it produces will have theAWSLambdaBasicExecutionRolepolicy and nothing else, which is sufficient as long as you grant permissions in the cluster policy.
Moving onto the second page of the wizard, you'll need to upload the ZIP that you created earlier, and set the following environment variables:
-
ELASTIC_SEARCH_HOSTNAMEidentifies the Elasticsearch cluster, and may be copied from the summary page in the AWS Console (note: just the hostname, not the full URL). -
INDEX_PREFIXis the index name that you specified in the Firehose config (eg: “logstash”). -
NUM_INDEXES_TO_KEEPspecifies the desired number of days (or hours, if you're using an hourly rotation interval) to retain.
Scrolling down this page, you want to leave “Networking” as “No VPC” and update the execution timeout to 30 seconds from the default 3. There's no need to change the default memory allotment; this isn't a memory-hungry script.
Testing
Once you've created the Lambda, you need to verify that it actually works — and you probably don't want to wait until you're out of space to do so. Fortunately, Lambda has a “Test” button that will run the function, providing it a predefined payload. For this function the specific payload doesn't matter; just use the default.
What does matter is that you have indexes that follow the specified naming pattern. Rather
that load actual logging data into the cluster, you can create the indexes with a simple
curl call:
curl -XPUT https://search-example-5flxfrid9q5q17qqq5qqqqqpqm.us-east-1.es.amazonaws.com/logstash-2018-01-01
Replace the URL with your cluster's URL, and create as many indexes as you like following the naming pattern. Once you've created these indexes, press the “Test” button and verify that only the desired number remain. If everything works you'll see a green box at the top of the Console, and the log message will show you the indexes that were deleted.
If the test failed, you'll see a red box with an error message. The most likely message is an authorization failure, which means that the cluster isn't configured to trust the Lambda function's role:
failed to retrieve indexes: {"Message":"User: arn:aws:sts::123456789012:assumed-role/Elasticsearch_Cleanup_Role/ElasticsearchCleanup is not authorized to perform: es:ESHttpGet"}
Triggered Invocation
For production use, you don't want to manually invoke the Lambda. Instead, use CloudWatch Events to trigger it on a regular schedule — for example, at midnight every day.
There are two things to remember about scheduled events: first, that times are specified in UTC. So if you want to run at midnight Eastern Daylight Time, which is 4 hours off UTC, you need to use the following expression (and remember that it will fire at 11 PM when daylight savings time ends):
0 4 * * ? *
The second thing to remember is that you can specify day-of-week or day-of-month but
not both. As shown above, one of these fields has to be “?”,
even if the other is “*”.
Regardless of whether you define the rule in the Lambda Console or the CloudWatch Events Console, AWS will take care of granting the correct permissions so that the rule can invoke the Lambda. Once you set it up you're good to go.
Examining archived logfiles with JQ
As I mentioned above, Firehose simply concatenates the input records together. This leaves you with files that aren't themselves valid JSON (which would wrap the records in an array). Fortunately, there are tools that can process files like that, and one is jq.
You should be able to install jq using your platform's package
manager; if not, the link above has installation instructions. To run it, you'll need
to download the relevant archive files from S3 (which means that you need to know the
approximate date that you want to examine). I prefer to keep them GZIPed, and use
zcat to uncompress them and further concatenate them before
passing to jq.
A full description of jq is beyond the scope of this article
(click on the link!). Here's a short example, which takes a set of compressed files,
finds all errors and prints their timestamp, logger name, and message.
zcat *.gz | jq -c 'select(.level == "ERROR") | [ .timestamp, .logger, .message ]' | more
While you can build up arbitrarily complex jq expressions, my
personal preference is to mimic a traditional text format, typically using the array
constructor shown above. Once you have that you can then turn back to tools like
grep to examine the results.
Incorporating CloudWatch Logs
One limitation of this architecture is that Amazon wants to send logs to CloudWatch
Logs: it's the default destination for Lamba and Batch executions, there's the
awslogs driver for Docker (including on-prem), and there's an
agent for EC2. But, although CloudWatch Logs has been getting more useful with the
addition of Insights, it's still not a great way to examine your application logs.
And splitting your logs between Elasticsearch and CloudWatch isn't a good option either.
The solution is a
CloudWatch Logs subscription,
in which the log group pushes new messages to a subscribed destination. CloudWatch
supports various destinations, including directly to Elasticsearch, but
after research,
I believe the best destination is a Kinesis stream. This stream then invokes a Lambda
that examines each message and transforms them into a consistent JSON format that can
be written into the existing pipeline:
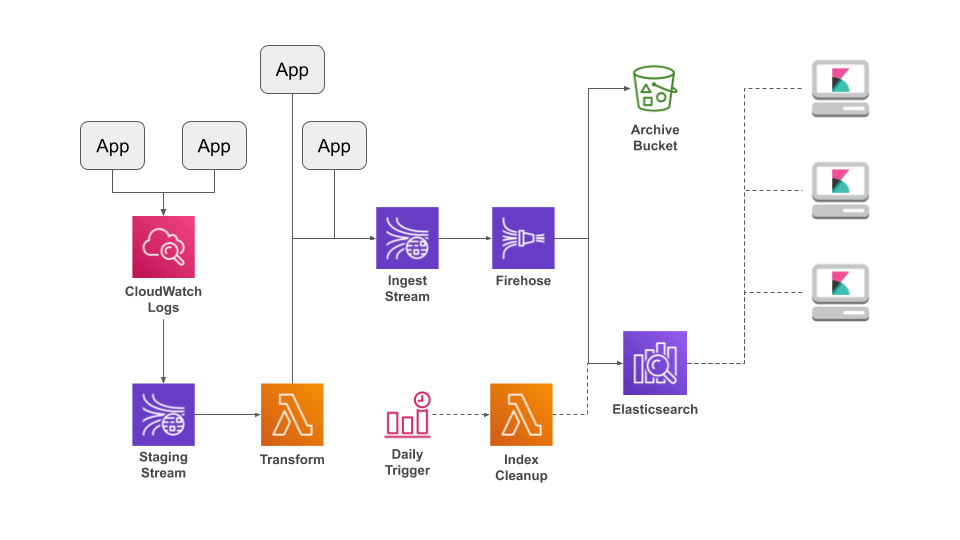
In the rest of this section I'll look at the general structure of the transformation Lambda, including record processing and writing to Kinesis. To avoid boring you, I'm going to skip most of the code. You can find the complete implementation, with CloudFormation and SAM templates, here.
Record Format
CloudWatch Logs writes messages to Kinesis as a JSON object. There are two types of messages: a control message is written at the time of subscription, to verify that CloudWatch can write to the stream; this is followed by data messages, shown below, that contain log events.
{
    "messageType": "DATA_MESSAGE",
    "owner": "012345678901",
    "logGroup": "AppenderExample",
    "logStream": "Example-20190825",
    "subscriptionFilters": ["CloudWatchSubscription-Subscription-184MSZXRD5MCP"],
    "logEvents": [
        {
            "id": "34939504216003552676187468284442890586332374987778818048",
            "timestamp": 1566741555269,
            "message": "some message\n"
        },
        {
            "id": "34939504216092755656981590777009033459422968433802739713",
            "timestamp": 1566741555273,
            "message": "another message\n"
        },
        {
            "id": "34939504239575440351034336945046144800521693099600117762",
            "timestamp": 1566741556326,
            "message": "still another\n"
        }
    ]
}
It's important to note that a data message can contain multiple log events. I don't
know whether each message corresponds to a single PutLogEvents call, or whether multiple calls are aggregated into a single message. Regardless, it
means that you can't simply subscribe a log group to the pipeline's ingest stream,
even if the events are already in JSON, because Firehose would not know how to deal
with them.
Multiple Kinesis records are then bundled into a single Lambda invocation; you can control the number of records when defining the Lambda trigger. Each source record is GZipped, Base64-encoded, and wrapped in another JSON object:
{
  "Records": [
    {
      "kinesis": {
          "kinesisSchemaVersion": "1.0",
          "partitionKey": "ea05911b7285b29393412d960053f81d",
          "sequenceNumber": "49598889268738564796327312231530438478076180289718059010",
          "data": "H4sIANoVbV0AA42QW2vCQBCFn5NfIfusMLs7e5m+BbU+CaURWtpKSXXRQExCsvaC+N+7sSn0QqUvC7PnMOebc4gjtnNtm23c4q127GLAJskieZxP0zSZTdkw6NVL6ZpOAS4kKm0sAT8pRbWZNdW+7sSkrl25ds30NdvVhfvUU9+4bNcZemEkgBNYoU6Odv/Urpq89nlVXuaFd00bvPdsXFT79U3mV9v0i2P0beAW5+nd7fVEzcdXbNkHTp9d6U9LDnEUsXzdZUskSQpQcA0glRLaaG4NaissIopwkbJaSiENkjXGWMstoO0YI+bzUJEP9GEVV1ob5KrbQSe1r6+LaaudG/TzQ8ni6Dgc/EFBwiillSbLFUFIBCCQoV5CIUhblNKCMJIMl2cpjPxJkZWV37rmPyDhNQoxVMJBhkhNGL41R7QAKnCSBKLQGefGaHEGREuhf9Xh86IY9DgfGMv4GL8DWgIaCnQCAAA=",
          "approximateArrivalTimestamp": 1566741561.188
      },
      "eventSource": "aws:kinesis",
      "eventVersion": "1.0",
      "eventID": "shardId-000000000000:49598889268738564796327312231530438478076180289718059010",
      "eventName": "aws:kinesis:record",
      "invokeIdentityArn": "arn:aws:iam::012345678901:role/DefaultLambdaProfile",
      "awsRegion": "us-east-1",
      "eventSourceARN": "arn:aws:kinesis:us-east-1:012345678901:stream/CloudWatchSubscriptionDestination"
    },
    ...
  ]
}
Lambda Implementation
The Lambda function has three responsibilities:
- Extract individual log events from the records that it receives.
- Transform those events into JSON if necessary.
- Write them to Kinesis.
My top-level handler function is pretty short: it accumulates log events from all
input records into the outputMessages array, then sends them
off to Kinesis.
def lambda_handler(event, context):
    outputMessages = []
    for record in event['Records']:
        outputMessages = outputMessages + process_input_record(record)
    logging.info(f'total number of messages to output: {len(outputMessages)}')
    logging.debug(f'output messages: {json.dumps(outputMessages)}')
    write_to_kinesis(outputMessages)
The process_input_record() function is responsible for extracting
and decoding the payload from each record in the invocation event. As you may remember,
there are two expected message types, and all we care about is the data message. If we
get a control message, or unrecognized message type, it's logged and ignored. In case
someone writes a completely bogus record into the source stream, the entire function is
enclosed in an exception handler.
def process_input_record(record):
    try:
        payload = record['kinesis']['data']
        decoded = gzip.decompress(base64.b64decode(payload))
        data = json.loads(decoded)
        message_type = data.get('messageType')
        if message_type == 'DATA_MESSAGE':
            logGroup = data['logGroup']
            logStream = data['logStream']
            events = data.get('logEvents', [])
            logging.info(f'processing {len(events)} events from group "{logGroup}" / stream "{logStream}"')
            logging.debug(f'input events: {json.dumps(events)}')
            return [transform_log_event(logGroup, logStream, event) for event in events]
        elif message_type == 'CONTROL_MESSAGE':
            logging.info('skipping control message')
        elif message_type:
            logging.warn(f'unexpected message type: {message_type}')
    except:
        logging.error(f'failed to process record; keys = {record.keys()}', exc_info=True)
    # fall-through for any unprocessed messages (exception or unhandled message type)
    return []
The next level down is transform_log_event() function, which
processes a single log event from the array in the record. I try a number of
“canned” conversions: is it already JSON? does it match a Lambda execution
report? does it match the
Lambda Python log format?
If none of these apply, the log event is turned into a simple JSON object. If you will
be processing messages from other sources (such as a
Node.JS Lambda),
this is the place to add your own parsing function.
def transform_log_event(logGroup, logStream, event):
    message = event.get('message', '').strip()
    result = try_parse_json(message)
    if not result:
        result = try_parse_python_log(message)
    if not result:
        result = try_parse_lambda_status(message)
    if not result:
        result = {
            'level': 'INFO',
            'message': message
        }

    result['cloudwatch'] = {
        'logGroup': logGroup,
        'logStream': logStream
    }
    opt_add_timestamp(result, event)
    return result
In addition to converting the event to JSON, I add a sub-object that identifies the source log group and stream, and optionally add the timestamp from the event. I'm assuming that most messages will already include a timestamp, reflecting the source program's sense of time; if so, it's preferable to a timestamp attached when writing the event.
Moving on to the output side: writing to Kinesis could be an article by itself, because you have to account for the following:
- For efficiency, you should send batches of records using the PutRecords API.
- To use this API, you need to break the array of input records into batches of no more than 500 records or 1 MB (the API is documented as allowing up to 5MB, but that only works if the records go to different shards, so it's easier to follow the lower limit).
- If the request is rejected due to throttling, you need to retry.
- Individual records within the request may be throttled, even if the request as a whole succeeds, and you need to retry just those records.
- Individual records may also be rejected due to “internal errors.” As the documentation doesn't indicate these can be retried, they need to be dropped lest you end up always trying to send the same undeliverable records.
- The request as a whole can be rejected due to an unrecoverable error, such as an incorrectly configured stream name.
The top-level sending function, write_to_kinesis(), first
converts the log events into the format expected by the
Python SDK.
It then works through the list, extracting a batch and sending it (the
process_batch() function returns any records that it can't
process). If unable to send the entire list of events as one batch (either
due to size or throttling) the function sleeps and then retries. Unless you
set the batch size extremely high when configuring the Lambda (see below),
all events should fit in a single batch.
def write_to_kinesis(listOfEvents):
    records = prepare_records(listOfEvents)
    while records:
        records = process_batch(records)
        if (records):
            time.sleep(2) # an arbitrary sleep; we should rarely hit this
    return
The process_batch() function is fairly simple: it first
divides the provided records into those that fit into a single batch and those
that don't. Then it attempts to send the records. If any records can't be sent,
they're prepended to the array of records that didn't fit in the batch, to be
sent the next time through.
def process_batch(records):
    toBeSent, toBeReturned = build_batch(records)
    logging.info(f'sending batch of {len(toBeSent)} records with {len(toBeReturned)} remaining')
    try:
        response = kinesisClient.put_records(
            StreamName=kinesisStream,
            Records=toBeSent
        )
        return process_response(response, toBeSent) + toBeReturned
    except kinesisClient.exceptions.ProvisionedThroughputExceededException:
        logging.warn(f'received throughput-exceeded on stream {kinesisStream}; retrying all messages')
        return toBeSent + toBeReturned
I'll wrap up this section with the function that processes the response from
PutRecords, because it's key to any code that writes to
Kinesis.
def process_response(response, records):
    if response['FailedRecordCount'] == 0:
        return []

    result = []
    droppedRecordCount = 0
    for ii in range(len(response['Records'])):
        entry = response['Records'][ii]
        errorCode = entry.get('ErrorCode')
        if errorCode == 'ProvisionedThroughputExceededException':
            result.append(records[ii])
        elif errorCode:
            droppedRecordCount += 1

    if droppedRecordCount > 0:
        logging.warn(f'dropped {droppedRecordCount} records due to Kinesis internal errors')
    if len(result) > 0:
        logging.info(f'requeueing {len(result)} records due to throughput-exceeded')

    return result
When you call PutRecords, you get back an array of status
objects, with a 1:1 correspondence to the array of records that you sent to the
API. If all goes well, these objects contain the sequence number assigned to the
source record. If, instead, they contain an error code, the function examines that
code to decide whether it's throttling (in which case the record should be retried)
or something else (in which case it should be dropped). The retryable records are
copied from the original request array into a returned array that can be added to
the next batch.
Deployment
Deploying this Lambda requires the following steps, which must be performed in order:
- Create the staging stream, and wait for it to become active (I'm going to assume that you've already created the ingest stream and the rest of the pipeline).
- Create an IAM role that allows CloudWatch Logs to write to this stream.
- Subscribe log groups to this stream.
- Upload the Lambda function and configure it.
- Create the event trigger.
You'll need to add a subscription for every log group that sends events to the staging
stream. You can't create these subscriptions via the AWS Console, so must use either
the CLI or a tool such as CloudFormation. To allow CloudWatch Logs to write to the stream, you
must create a service-linked role (the principal is CloudWatch Logs) that enables the
kinesis:PutRecord permission. To avoid accidents, the resource
specified by the role's policy should be the staging stream (not “*”).
The Lambda trigger (aka event source mapping) controls how frequently the Lambda function will be invoked, and how many records are sent in each batch. To reduce costs, you'll want infrequent invocations, but against that you'll probably want to see log records soon after they're written. If you pick one second (the default), that translates to approximately 2.5 million invocations a month. I think 10 seconds, or even 30, is a reasonable lag time for log events, and keeps your invocations well within the Lambda free tier.
For batch size, I think 100 records is reasonable, and unlikely to be reached unless you have a large number of subscribed streams. With 100 records, and assuming a dozen or so events per record, you can run the Lambda with the minimum 128 MB memory allotment.
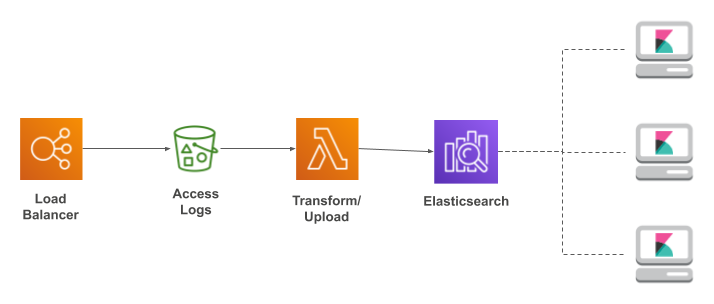
Load Balancer Logging: S3, Lambda, AWS Elasticsearch
I'm going to wrap up with a section on using Elasticsearch to analyze logs from an
Elastic Load Balancer. This process uses a different pipeline: the load balancer
writes logfiles to S3,
which triggers a Lambda function that writes their contents to Elasticsearch.
The only decision that you'll have to make for this pipeline is how frequently the ELB should write its logs to S3. You have two choices: every five minutes or every hour. Which you pick depends on how quickly you want to see updates, versus how big the files will be. As with application log archives, large files are only important if you plan to use “infrequent access” storage on S3. And personally, I prefer the immediate feedback offered by a five minute interval.
Example ELB log line
Each line in the ELB logfile looks like this:
2018-04-30T12:40:34.740628Z example 173.49.123.456:58798 172.30.1.119:80 0.000037 0.001039 0.000046 200 200 0 43862 "GET http://example-1886477337.us-east-1.elb.amazonaws.com:80/index.php?page=scm.git HTTP/1.1" "curl/7.47.0" - -
Breaking it down, we have the following components:
2018-04-30T12:40:34.740628Z | UTC timestamp when the request was received by the ELB, in ISO-8601 format. |
example | The name of the load balancer. While this seems redundant, since each ELB writes to its own logging directory, it's useful when preparing records for Elasticsearch. |
173.49.123.456:58798 172.30.1.119:80 | The source and destination addresses.
The source address is useful to discover clients that are making an unnatural level of requests: they may be probing the system for weaknesses. The destination address is useful for determining whether your backend instances are receiving equal amounts of work: if one has significantly more requests than another it may indicate that those requests are erroring-out. |
0.000037 0.001039 0.000046 | Request processing time. This consists of three components:
|
200 200 | The first number is the HTTP status code returned from the ELB to the client, while the
second is the status code returned from the instance to the ELB.
Most of the time, they'll be the same. If the instance is unresponsive, however, its
status code will be a dash (“ |
0 43862 | These two numbers are the size of the request and response bodies, in bytes. |
"GET http://example-1886477337.us-east-1.elb.amazonaws.com:80/index.php?page=scm.git HTTP/1.1" | This is the original request line, including HTTP verb, URL, and HTTP version. We'll break it into pieces before uploading to Elasticsearch. |
"curl/7.47.0" | This is the user agent. |
- - | These two fields are the HTTPS cipher and protocol for the request. When you see dashes, as here, it means that the request was using plain HTTP. |
The Lambda function
This one's a little long, so I'm going to break it into pieces. Skipping over the headers and import statements (you can find the full script here), here's the start of the actual code:
es_hostname = os.environ["ELASTIC_SEARCH_HOSTNAME"]
batch_size = int(os.environ["BATCH_SIZE"])
These are the two environment variables that configure the Lambda. As with the cleanup
Lambda, ELASTIC_SEARCH_HOSTNAME lets us construct URLs for the
Elasticseach cluster. BATCH_SIZE will be described below.
The heart of the Lambda is a massive regular expression to pull pieces out of the ELB log line. In addition to breaking apart the log line, I also use regexes to extract additional information, in this case the hostname from the request URL (which is useful if you exposing the same service under different hostnames).
baseRE = re.compile(
    (
    r'^(\d{4}-\d{2}-\d{2}T\d+:\d+:\d+\.\d+Z) '    # timestamp
    r'([^ ]+) '                                   # elb_name
    r'(\d+\.\d+\.\d+\.\d+):(\d+) '                # client_ip, client_port
    r'(\d+\.\d+\.\d+\.\d+):(\d+) '                # backend_ip, backend_port
    r'([0-9.-]+) '                                # request_processing_time
    r'([0-9.-]+) '                                # backend_processing_time
    r'([0-9.-]+) '                                # response_processing_time
    r'(\d{3}) '                                   # elb_status_code
    r'(\d{3}) '                                   # backend_status_code
    r'(\d+) '                                     # received_bytes
    r'(\d+) '                                     # sent_bytes
    r'"([A-Z]+) '                                 # http_method
    r'([^ ]+) '                                   # http_url
    r'([^ ]+)" '                                  # http_version
    r'"(.+)" '                                    # user_agent
    r'(.+) '                                      # ssl_cipher
    r'(.+)$'                                      # ssl_protocol
    ))

# this regex extracts the host portion of the url
hostRE = re.compile(r'[Hh][Tt][Tt][Pp][Ss]?://([^:/]+).*')
Here I define the AWS resources used by the Lambda: a reference to the S3 service and a signer for Elasticsearch HTTP requests. The environment variables here are provided by the Lambda execution environment.
s3 = boto3.resource("s3")
auth = AWSRequestsAuth(aws_access_key=os.environ["AWS_ACCESS_KEY_ID"],
                       aws_secret_access_key=os.environ["AWS_SECRET_ACCESS_KEY"],
                       aws_token=os.environ["AWS_SESSION_TOKEN"],
                       aws_region=os.environ["AWS_REGION"],
                       aws_service="es",
                       aws_host=es_hostname)
Next is the Lambda entry point. The function is passed an S3-specific event structure that we have to pull apart to find the actual file(s) that were written. In practice, only one file gets written at a time, but we still have to process an array of records.
def lambda_handler(event, context):
    """The entry point for the Lambda function."""
    for rec in event["Records"]:
        s3_bucket = rec["s3"]["bucket"]["name"]
        s3_key = rec["s3"]["object"]["key"]
        process_file(s3_bucket, s3_key)
Each file gets processed independently. The first task is to download the file from S3 into the Lambda execution environment, so that we can open it from within Python. Since temporary space in the Lambda environment is limited, we store the file in a temporary directory that's deleted (along with its contents) as soon as the function is done (if you're storing hourly logfiles with an active server, you may not have enough space to download them — either switch to five-minute intervals or store compressed files and decompress them on the fly).
This function is where the batch size configuration is used: a Lambda function has a limited amount of memory, which may not be enough to hold all of the rows of a file (you can always pay for more memory, but it would be wasted for smaller files). There's also a limit on the size of an Elasticsearch network request, which varies by the size of the cluster's instances. My philosophy is that it's easier to set a limit when processing the file, and adjust that limit based on how much memory the Lambda consumes (a batch size of 5,000 entries is a good starting place).
def process_file(s3_bucket, s3_key):
    """Handles a single uploaded file, transforming its contents and writing to Elasticsearch."""
    print("processing: s3://" + s3_bucket + "/" + s3_key)
    base_id = hashlib.sha1(s3_key.encode('utf-8')).hexdigest()
    with tempfile.TemporaryDirectory() as tmpdir:
        srcFile = os.path.join(tmpdir, "elb_log.txt")
        s3.Bucket(s3_bucket).download_file(s3_key, srcFile)
        recnum = 0;
        batch = []
        with open(srcFile, "r") as src:
            for s in src:
                recnum += 1
                batch += process_record(base_id, recnum, s)
                if recnum % batch_size == 0:
                    do_upload(batch, recnum)
                    batch = []
            do_upload(batch, recnum)
Each record in the file is passed to this function, which parses the text and writes it as a pair of JSON strings that are combined to form the batch. The first of these strings gives Elasticsearch information about how to index the record; here I'm using hourly indexes based on the record's timestamp. The second is the actual data.
def process_record(base_id, recnum, s):
    """Parses a single ELB log entry and creates an entry for the bulk upload."""
    data = parse(s)
    index_name = "elb-" + data["timestamp"][0:13].lower()
    record_id = base_id + "-" + str(recnum)
    return [
        json.dumps({ "index": { "_index": index_name, "_type": "elb_access_log", "_id": record_id }}),
        json.dumps(data)
        ]
The Lambda writes batches of records to the Elasticsearch cluster's bulk update API.
This has to be a signed request, using the auth object to
create appropriate headers for the requests module.
def do_upload(batch, recnum):
    """Combines a list of updates into a single Elasticsearch request."""
    print("uploading batch ending at record " + str(recnum))
    rsp = requests.post("https://" + es_hostname + "/_bulk",
                        headers={"Content-Type": "application/x-ndjson"},
                        auth=auth,
                        data="\n".join(batch) + "\n")
    if rsp.status_code != 200:
        raise BaseException("unable to upload: " + rsp.text)
Finally, this is where a log entry gets parsed into fields, using the regex defined
at the top of the file. The fields representing processing time get turned into
numeric values, which will allow Elasticsearch to sort them in “natural”
order; the exception handler is required because the log entry will have a non-parseable
“-” if the back-end wasn't accepting requests.
One thing to note here is the separate regex that extracts the hostname from the URL.
This particular field is only useful if you have traffic for multiple domains
(“www.example.com” and “example.com” count), but it's a technique that's generally useful: pull out site-specific fields that
might be used for analysis. My website, for example, uses “page” to identify the article; by extracting the associated value, I can do an easy breakdown
of traffic by destination.
def parse(s):
    """Extracts fields from an ELB log entry and returns them in a map."""
    m = baseRE.search(s)
    result = {}
    result["timestamp"]                     = m.group(1)
    result["elb_name"]                      = m.group(2)
    result["client_ip"]                     = m.group(3)
    result["client_port"]                   = m.group(4)
    result["backend_ip"]                    = m.group(5)
    result["backend_port"]                  = m.group(6)
    try:
        result["request_processing_time"]   = float(m.group(7))
    except:
        pass
    try:
        result["backend_processing_time"]   = float(m.group(8))
    except:
        pass
    try:
        result["response_processing_time"]  = float(m.group(9))
    except:
        pass
    result["elb_status_code"]               = m.group(10)
    result["backend_status_code"]           = m.group(11)
    result["received_bytes"]                = int(m.group(12))
    result["sent_bytes"]                    = int(m.group(13))
    result["http_method"]                   = m.group(14)
    result["http_url"]                      = m.group(15)
    result["http_version "]                 = m.group(16)
    result["user_agent"]                    = m.group(17)
    result["ssl_cipher"]                    = m.group(18)
    result["ssl_protocol"]                  = m.group(19)

    result["host"] = hostRE.match(m.group(15)).group(1)

    return result
Deployment
As with the cleanup Lambda, you have to create a directory and build a ZIPfile from it.
mkdir elb-to-es
cd elb-to-es

wget https://raw.githubusercontent.com/kdgregory/aws-misc/master/lambda/elb-to-es/lambda_function.py

pip3 install -t `pwd` requests aws-requests-auth

zip -r /tmp/elb-to-es.zip .
You'll also need to create an execution role. For this one you can use the predefined
“AmazonS3ReadOnlyAccess” policy as well as
“AWSLambdaBasicExecutionRole”. You also need to grant it
“es:ESHttpPost”, either as a policy in the execution
role or (as I prefer) in the cluster's policy.
Document History
| Date | Description |
|---|---|
| 2019-09-25 | Add section on streaming CloudWatch Logs into the pipeline |
| 2019-07-06 | Minor text updates; update diagrams; add more information about Kinesis Agent |
| 2018-08-04 | Initial revision |
For More Information
My appenders library for Log4J/Lagback is here. If you have any problems using it, please let me know.
If you're using Python,
here's an example of formatting log output in JSON that's compatible with that produced
by JSONLayout.
I also have a library of miscellaneous AWS-related scripts. You'll find both the index cleanup and the ELB log delivery Lambdas there.
I used a lot of Amazon services for this article. I linked to are their user guides when introducing the service, but here are all of the links in one place:
I only touched on the features of Kibana. For more information, see the Kibana User Guide.
In case you missed the link earlier, here's Amazon's documentation on how to size your Elasticsearch cluster.
Sizing Elasticsearch indexes is also something of a black art. You can read the Elastic docs, but ultimately your only control over index size is how frequently you rotate the indexes.
Copyright © Keith D Gregory, all rights reserved